How to... make a web page table in to a multi colour line graph.
|

|
|
1. Source the data
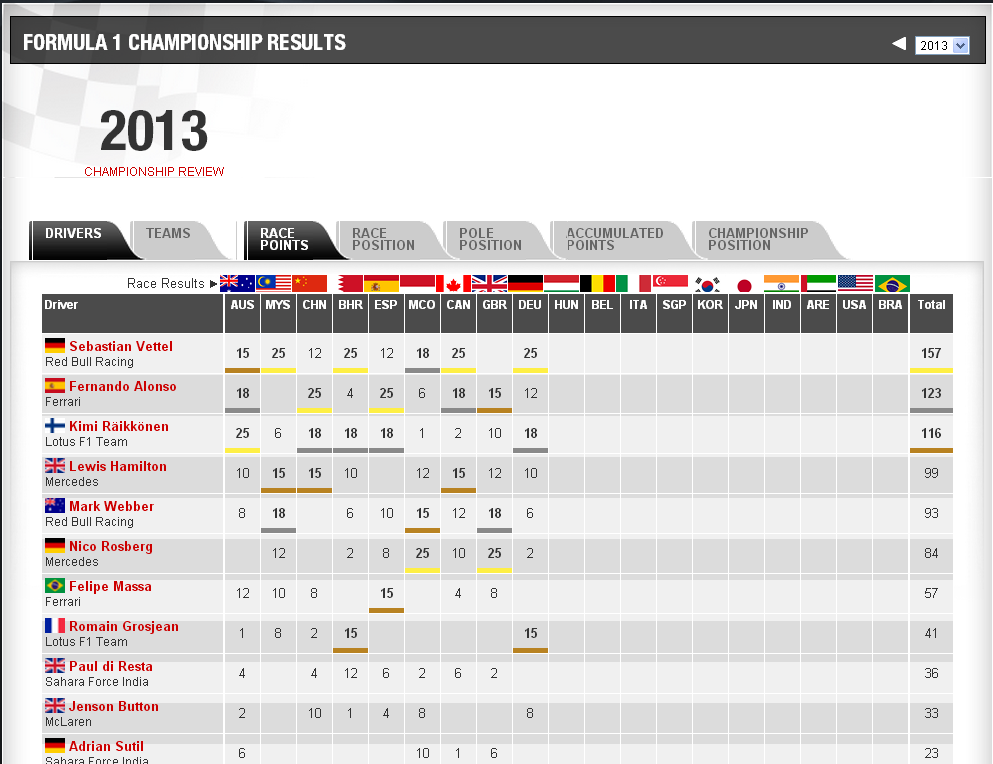
Data can be entered manually (point by point data entry), sourced from a spreadsheet, or, in many cases, from a table in a word processor document or web page, such as the one at left*.
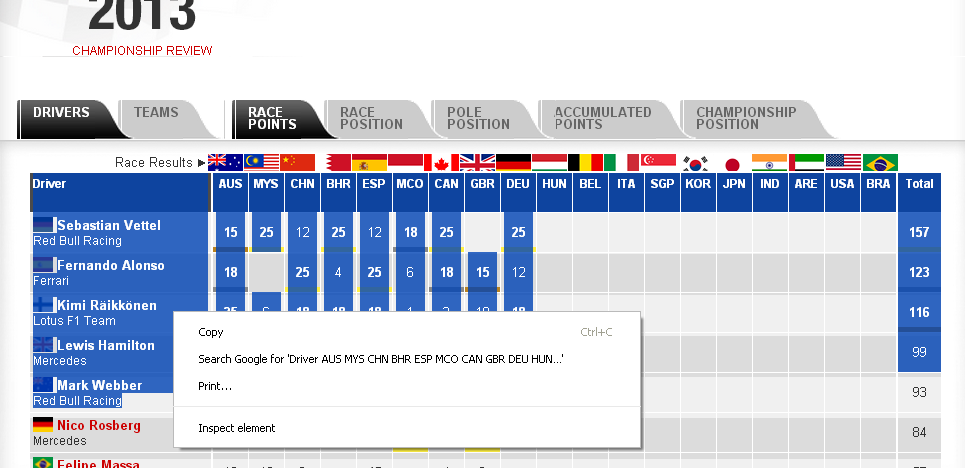
The required data is selected in the source document. The left most column is required to provide the record (line) name, the top row is required to provide the values for the X axis. The selection is now copied to the clipboard - usually right-click and select Copy.
2. Format data in a spreadsheet
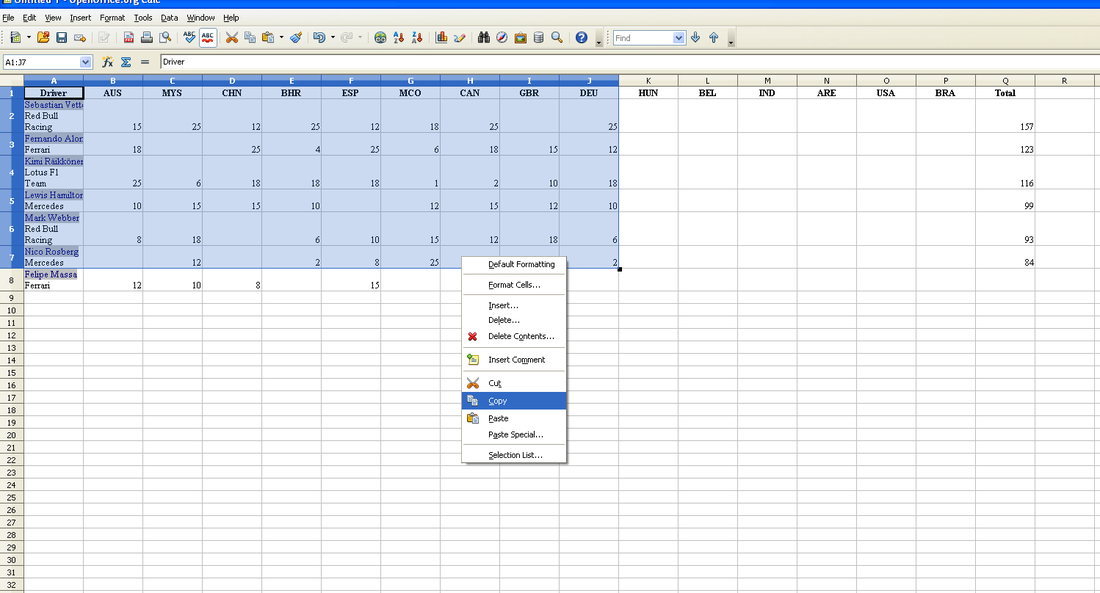
The data copied to the clipboard is now pasted in to your spreadsheet. This data will likely need some editing to meet the format needed for importing in to GME. In this example, the top row extends beyond the range of data required, and there is data below the selection that is not used.
Some tables may include data that is not needed, such as the total column (far right) in this example. This data can be removed by deleting the column out of the spreadsheet, or, as in this case, leaving it out of the selection to be copied to the clipboard.
GME import requires a left column and top row, for line names and X axes respectively. Cells out side of the left column and top row need to be numeric, or blank. GME reads non-numeric and blank cells as zeroes.
Cells may contain extra information, such as asterisks or dollar signs, that will need to be removed. This could achieved by using the Find/Replace function of your spreadsheet, replacing the asterisk with nothing.
The formatted selection can now be copied to the Windows clipboard.
3. Import in to GME
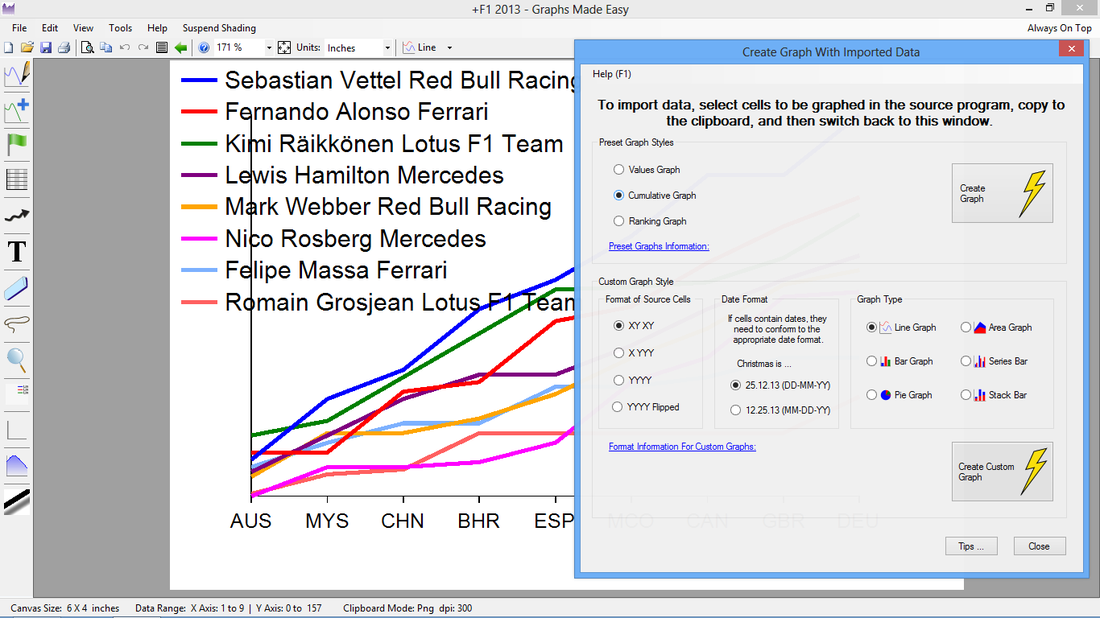
To import the data stored on the clipboard, switch back to GME, and open the Import Data window. For this example, a cumulative graph is needed, so that values are added to a total going left to right, with the total value being plotted. Information links provide detailed information. The Create Graph button creates the graph displayed. The X axis is populated with the values of the top row of the selection, while the line names take the values in the left column. GME sets the line colours arbitrarily, which can then be edited (see below).
4. Edit lines
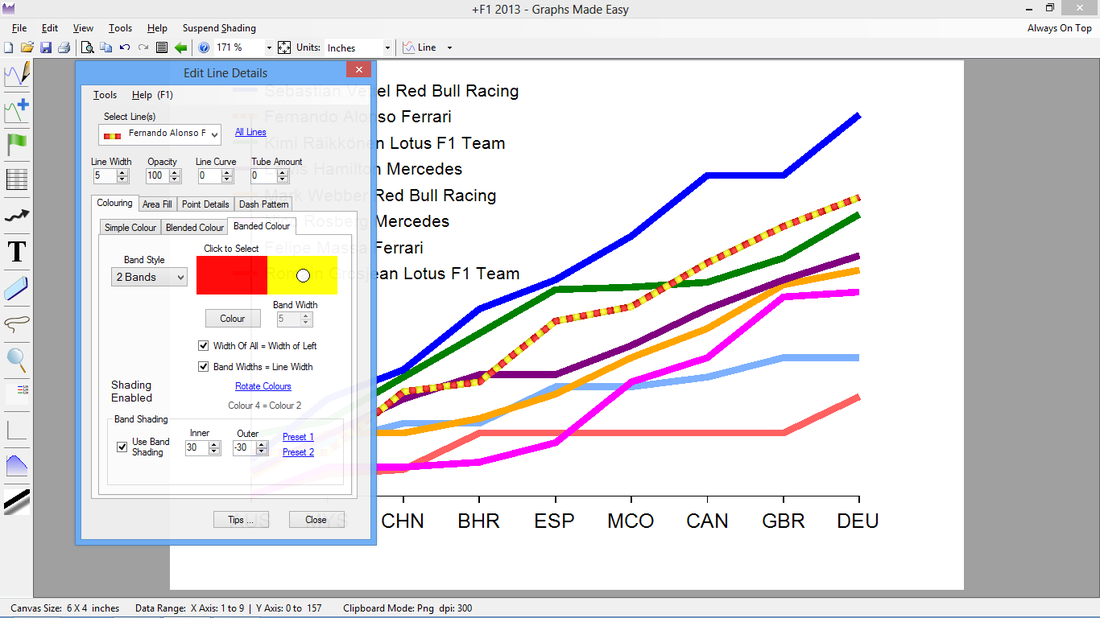
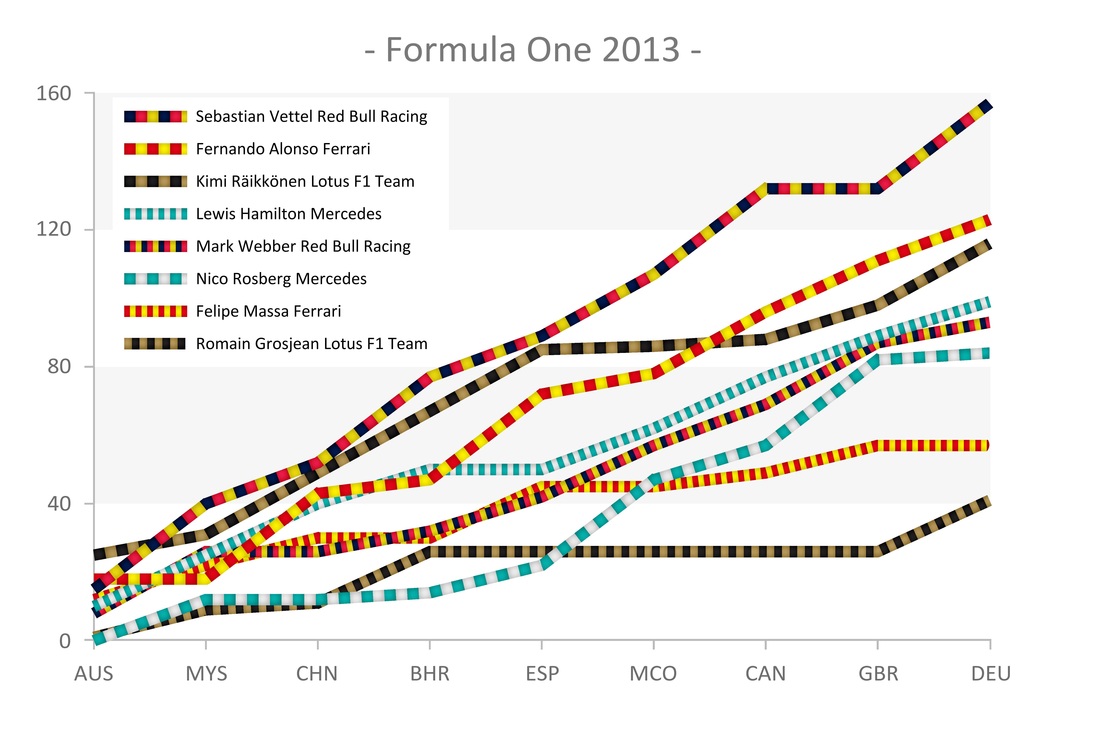
Line colours are set by right-clicking a point of the line to open the Edit Line Details window. Selecting the Banded Colour tab, within the Colouring tab accesses the window seen at left. The band style used here is 2 Bands, for the team colours of Ferrari - red and yellow. Each line is edited separately. GME provides options of tubular or banded shading, and the amounts of shading can be fine-tuned. Where there are two or more lines with the same colours, e.g. team colours, as with this example, they can be differentiated by setting wide and narrow band widths. With minor additional editing, the graph at the top of this page is complete.
GME further provides facility to include or exclude lines from the Line Manager, as well as to edit the 'Z-Order' (whether each line is drawn over or under other lines). The Line Manager is accessed by clicking the icon, or pressing Ctrl + R from the main window.
GME further provides facility to include or exclude lines from the Line Manager, as well as to edit the 'Z-Order' (whether each line is drawn over or under other lines). The Line Manager is accessed by clicking the icon, or pressing Ctrl + R from the main window.
* F1 table sourced from www.f1plus.com.