GME has now been withdrawn as a commercial product. The save-disabled demo can downloaded below. Expressions of interest in purchasing the source code or domain name can be addressed to dingosunglasses@gmail.com
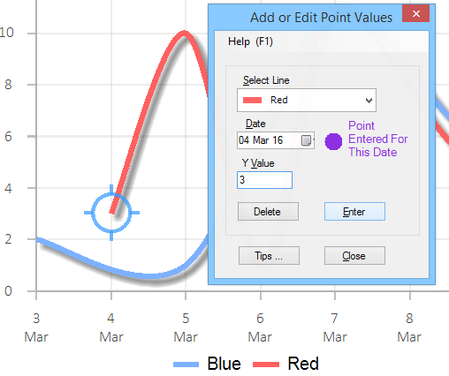
Features include: Self-explanatory user interface - no learning curve Dates or numbers on the X-axis Save graphs in popular graphics file formats, or copy and paste in to target applications Option to import data from spreadsheet style applications